This plot shows daily loads from Jun to Nov 2008. :

We have an average of ~ 200 per week. Something happened in mid September that produced a sustained increase to ~260 per week since then on. The effect of the recent FireSeat 2008 and the new blog in Nov is obvious and has doubled the normal number of visitors (but now perhaps somehow decaying).
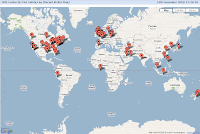
See also here a map of the world with the location of most recent
visitors.

No comments:
Post a Comment