 Dr Frank Rushbrook, former firemaster of Edinburgh & Lothians Fire Brigade, and one of the leading players in establishing the fire research group in the 1970s, and the 'Rushbrook' fire laboratory in the early 2000s, visited the lab this afternoon. Here is his introduction to the fire tornado experiment.
Monday, February 28, 2011
Dr Rushbrook meets the Fire Tornado
Dr Frank Rushbrook, former firemaster of Edinburgh & Lothians Fire Brigade, and one of the leading players in establishing the fire research group in the 1970s, and the 'Rushbrook' fire laboratory in the early 2000s, visited the lab this afternoon. Here is his introduction to the fire tornado experiment.Friday, February 18, 2011
Princeton - A Learning Experience
I'm typing this post while having coffee at the Woodrow Wilson school on Princeton University's campus. I've been in Princeton over 3 weeks now and I'm absolutely loving it. I get up each morning, eat my breakfast in a ridiculous Hogwarts-esque dining hall then head off to class. I choose what classes I want to sit in on (and I usually try and pack in as many as I can). Last week for example, I attended lectures on Stochastic Calculus of Brownian Motion, Economics of Crime, Democracy in Architecture, Bridge Design and Entrepreneurship. This broad range of classes wouldn't appear unusual to any student studying here - they have a very general view of ‘education’ that I haven't experienced anywhere else.

But, I'm getting ahead of myself. Perhaps I should explain why I'm here in the first place.
I'm studying a PhD in ‘Education in Fire Safety Engineering’. As most of you are aware, Edinburgh already has a very well established fire safety program, but it's not perfect so it can be improved. The question is how? I could spend years trying and testing a range of different teaching styles, or I could just ask a world-class university how they do it.
I chose the latter.
Now, when I sit in on a class I observe student-teacher interactions and take notes on the effects of different teaching styles. Sometimes the students are engaged, other times they're asleep. After studying a diverse range of teachers, I'm beginning to see patterns emerge. It appears there are some fundamental things that if you do/don't do you'll lose your audience, no matter how good you think you are. I'll share some of these with you now.
Probably the most significant observation I've made so far, and from what I can see is the biggest motivator for the students, is choice. In every aspect of what they do here, students are given choice - they choose what classes they do, what subject to specialise in, what topics to present, what groups to work in. This seems to result in a lot less admin which is a bonus, but the real value of this is the positive impact it has on student's self-motivation.
The logic behind it is this: If you want people to be responsible, self-directed individuals, treat them like responsible, self-directed individuals. Having to make choices every day not only promotes accountability and responsibility, but it gives people the opportunity to improve their judgement. And in engineering, particularly in fire safety engineering where reliable data is hard to come by, good judgement is essential.
The second thing that has a huge impact on classroom learning is divergent questioning. From what I've seen/read in my research, most teachers ask convergent questions (i.e. the opposite of what they should be doing). A convergent question is better known as a ‘guess-what-I'm-thinking’ question. The lecturer/tutor may ask something like “what is the main purpose of a roof”. The question is trying to force students towards one answer, so understandably students are reluctant to answer. They realise that there is only one answer and every single other answer they could give...is wrong. So in response to the roof question above, there'll be an awkward silence with students desperately trying to avoid eye-contact, followed by the lecturer answering his/her own question. “It's to keep the water out, obviously. Come on I asked you this question in the test last week remember? I asked, what is the purpose of a raincoat.” There is not really any point in asking convergent questions because asking someone to repeat something is not proof that they have understood it (as almost any teacher will tell you).
My suggestion is that if you want them to memorise a fact, just tell them the fact. Don't ask leading questions.
If you want them to think about something and really understand it, ask them to think. This is where divergent questioning comes in. If you want people to think, ask a question they can't get wrong, one that asks for their opinion. Such a question is phrased like this: “What do you think a roof does?” The students can come up with a range of ideas, and they're all correct. If they don't say what you want them to say, then it tells you something as an educator - namely that the students don't think the information is relevant. At least not yet.
This brings me to my third and final point, purpose. The purpose is the reason why your students are putting in so much of their time and effort to understand new ideas. Every rule in our society, every course in university, every word that's ever been spoken in a lecture has an underlying purpose - a “need-to-know”. Too often lecturers jump into complex methods before creating that “need-to-know”. It's like showing someone a path, without saying where they're going. No two people think the same way, so it's unlikely anyone else apart from you will choose the same path, it just won't make sense to anyone else.
It is often difficult to identify the purpose of a course, despite the fact that many lecturers think they've already done so. There is actually a straightforward test one can use to find a purpose - a reason - for everything. The test was developed by a five year-old - actually, every five year-old - and it consists of asking “Why?”…repeatedly. It's simple, they won't stop until you give them a valid reason, a purpose.
Just yesterday, I had the opportunity to test these ideas, or rather to ask someone else to test these ideas. One of the tutors here was running a tutorial where he was going to ask the students to discuss a lab they'd done the previous week. His idea was to choose a ‘volunteer’ to come up to the board and describe their lab to the rest of the students while he fired convergent questions at them (to make sure they covered all the material). The purpose was to make sure they said everything that might be asked in the exam.
See anything wrong with this picture?
I spent about 10mins explaining the theories above and he left enthusiastic about his upcoming class. Later on I joined him in his tutorial and listened to a full blown discussion going on amongst the students, each one eager to question and challenge each other's point of view. The class finished early, the students said it felt very “comfortable” and the tutor just looked shell-shocked. “That was so much better than last year!” he kept saying. “Thank you!”
I smiled and left. I felt good. After all, I had just improved teaching at Princeton University, even if it was only one small part of it.
How Uncertainty Transforms the Way we Quantify Fire
Posted in the name of Prof Jose Torero.
(related to the previous blog entry "Study or Gamble, but not both - 2nd annual Christmas tree fire test")
It is common practise to use experimental data for many purposes in the analysis of Fire Safety. It can be used as direct input (HRR, flame spread rates, ignition times, etc.) to models (analytical, semi empirical and CFD) as well as to obtain parameters that then can be used as input to other more fundamental models (heat of combustion, thermal properties, etc.). In many cases, due to the complexity of the tests, we rely of single data points to infer the values that we need. We can conduct a detailed analysis of the data and provide output values. In this particular case, the output values were the pHRR and the burn time of the tree. If I was to use this data for modelling, both parameters will be of critical importance and I could define a Q_dot=alpha x t^2 fire on the basis of both parameters. Furthermore, I could divide the HRR curve by the burning rate and obtain a heat of combustion that together with a flame spread model I could convert into another form of Q_dot. I could even use this data as part of a fundamental model that will attempt to predict all processes involved. Much of the research work we do tries to do two things, develop better models and try to make best use of the data we have. Thus this test is a fun example of what we are all about!
So, given the interest that this particular test has created I thought that it will be important to do a little exercise of uncertainty, not to question the winner, or to question the methodology used in defining this winner, simply to establish how important it is to look at these tests with caution and how difficult it is to use them in a manner that is truly representative of the event we are trying to describe via our engineering techniques. Furthermore, it is important to do this analysis to establish one of the key values of apriori estimations coupled with aposteriori explanations.
Apriori estimations have the distinct value of providing predictions that are only biased by the user’s knowledge or experience and not by the knowledge inferred through the observation of the test. Aposteriori estimations always carry the bias associated to having the knowledge of the results of the test. The aposteriori analysis of the apriori predictions reveals the effectiveness of the thought process associated to the apriori predictions. This analysis is extremely valuable in the sense that it can allow to separate the logic that is “user robust” from that that is purely a “guess.” It is also important because it allows establishing which of these “user robust” criteria have large experimental variability. Finally, it allows to identify common errors that can lead you to a “bad guess” but most important to a “good guess.” “User robust” logic with known “variability” is what we want to use to interpret test data and extract this information to introduce into our Fire Safety calculations.
I will do an aposteriori analysis of my estimates not to over-emphasize/or counteract the ridicule of being among the furthest away from the answer or to incontestably establish how my brain seems to have deteriorated with years doing fire research. The objective of this analysis is to encourage you to retrospect on how you achieve your estimate, post it, and let’s see what are the “user robust” criteria, which criteria is not robust, what were purely “guesses” and of these which ones are good or bad.
I know I am taking the risk of taking the joy out of a fun event, but given my role as an educator I find myself compelled to do this. The effort put on the tests and Guillermo’s fantastic statistical analysis encouraged me to do this. In any case, if you do not feel it is important, you will not participate and that is the end of the story!
900 kW and 20 seconds – How did I get there?
The way I reached my estimates, which I tried to qualify, but was told I could not (fair enough), was based on my experience of similar data published in the literature and the previous test conducted in Edinburgh.
When estimating the pHRR I made the following assumptions:
• The variability between tress in the literature was small.
• The pHRR was dominated by upward flame spread (VS) and time to burn out (tBO) of the leaves. Lateral flame spread is negligible compared to upward flame spread of a fuel of such low density, thus the effect of radial spread will happen after the pHRR.
• The base of the fuel burning (A) will be dominated by buoyancy not lateral spread, thus it should be the same for all tests.
• The tBO is very small and the base of the tree tends to have a higher density than the top, thus the pHRR will be generally attained before the flames reach the top of the tree.
• The HRR (given that this is a low density porous medium) will be proportional to the burning volume, so given a constant value of “A” it will be proportional to the height, thus to H=VS.t_b.
• The available data generally estimates a pHRR that ranges between 900 kW and 1100 kW.
So, given that the real height of the tree should not matter, then the pHRR should be similar to that of the literature. Because the tree was small, it was not so dry and it did not seem that dense I decided to opt for the lower bound value and estimate 900 kW.

Now, that being said, generally, literature values tend to be corrected by the time delay of the calorimeter. Our calorimeter has a time delay of about 10 seconds. What does that mean? Basically, it means that oxygen consumption measurements lag by 10 seconds the mass burning rate measurements. This generally makes no difference for events where things do not change within that period. If the event time scale is of the same order of magnitude of the time delay, then the measured value is somewhere between the measurement and that 10 seconds later. So, if I was to take the HRR curve measured by the calorimeter, then the value will be somewhere between what was measured 697 +/- 25 kW and 1000 kW.
An important lesson to learn is that the pHRR of a fast event (actually, even a slow event, but for different reasons) is a very difficult quantity to estimate precisely, thus the +/-25 kW stated as the error is truly only the direct measurement error. The true error will have to include the variability associated to the burn out time, the buoyantly driven upward spread, the global density and the comprehensive experimental error which is a parameter that is relevant in this case because the times are so short. So, any estimates within +/- 200 kW will probably have exactly the same value if the variable used is the pHRR. Thus 11/28 of you truly guessed the same answer.
If a different variable, such as the average HRR, or the Heat of Combustion was to be used as the “estimate,” then once all corrections due to time delay were made, would have probably delivered a smaller error bar.

The second variable to be estimated was the burning time. My estimate was 20 seconds and was based on a simple calculation of a typical upward flame spread rate of 10 cm a second. This had nothing to do with trees but with a fuel I know better (polyurethane foam). I estimated that the global value of “krhoC” is dominated by the density and I assumed that the density was more or less the same for both fuels. Thus I took that number. The tree was about 1.5 m, this gave about 15 seconds, time to burnout is so short that once the flame spread to the top, I could assume the fire was over.
Now, here is where I tried (unsuccessfully) to introduce a qualifier, I could not engage to estimate the initiation time (from the moment of ignition to the moment when the fire truly takes off). Furthermore, after the pHRR, what is left is lateral spread, then the branches and finally the trunk. The trunk will extinguish as soon as the branches die (bulk wood does not burn unless assisted!), but the lateral spread (being dominated by the shape of the tree) and the branches (being dominated by their individual shape and size) are impossible to predict. So at the end I gave up and simply estimated the time that it will take to achieve the pHRR from the moment the fire truly takes off. I reluctantly added a 5 second buffer for the slow initiation. While not a good estimate for what I was being asked, there is something to be said for the accuracy of the estimate! From the HRR curve we can establish that the primary burning will be somewhere between 10-20 sec (considering the instrument delay).
Now, what have I learnt, buoyancy is such a strong driving force that the estimate of the upward flame spread is a very robust one. The estimate of total burning time is one that carries a massive error bar, thus I will be reluctant to dismiss any of your estimates. From my perspective 28/28 gave estimates that I will consider within the expected error bars. Needless to say, last year’s Christmas tree was the proof to this point; the initial time could have been infinite if I did not decide to push the candle towards the denser part of the tree!
A final point, did I think of all of this in the 2 minutes that passed between the moment I learnt of the bet and the moment I provided my estimates? Obviously not! Most of this knowledge resides within your experience, and the estimate is an “educated guess.” Nevertheless, for the estimate to be adequate we need to carefully assess the question being asked (which I unfortunately decided to ignore) and the question needs to be posed correctly (meaning that what is being asked needs to have error bars that are smaller than the discrimination we are seeking). Otherwise, our guess will not be educated, nor it will be an estimate, it will just be a guess. If the error bars are small your chances of being the closest answer are very small (the educated estimate will have a much greater chance), but if the error bars are large you have as much of a chance to get it right as the most educated of estimates.
So citing Guillermo Rein: “while many stories can be told aposteriori,” and 3 hours of rationalizing my estimates can lead to this story, the stories need to be told and the discussion needs to follow. It is within the aposteriori 3 hours of introspection that I have truly managed to gain some insight into what happened not within the 2 minutes it took me to “guess.”
Congratulations to the winner!
Prof Jose Torero.
Saturday, February 12, 2011
Study or Gamble, but not both - 2nd annual Christmas tree fire test
An esteemed colleague had generously donated a Christmas tree to the scientific cause for the 2nd annual Christmas tree fire test. It had been used in the living room during the winter celebrations.
The tree was a Nordmann Fir of conical shape, 1.5 m tall and 0.9 m diameter at the bottom. It weighted 4.74 kg and was in dry conditions (measured in the oven at ~8% moisture content in dry base) after having spent one month not watered inside a warm living room.
Before conducting the experiment, fire experts were asked to bet on the peak heat release rate (pHRR) and the burning time (t_b). We recorded 28 guesses (£1 was collected per guess). A person with no research experience and no previous knowledge on fire dynamics (an international lawyer) was asked to provide a guess and act as control. NOTE: This required explaining the concept of HRR in layman terms, after which the control quantified the pHRR in terms of the equivalent number of burning matches.
Significant spread was recorded in the guesses. pHHR guesses ranged from 400 and 2300 kW, with average at 1173 kW. Guesses for t_b ranged from 15 to 377 s, with an average of 120 s. Two people provided guesses for pHRR but not for t_b, so they were assigned the average t_b value from the other participants.
The tree was ignited putting a small household candle next to the tree trunk at 1/3 of the height from the base. The HRR was measured using oxygen consumption calorimetry (corrected for CO and CO2 production). Figure 2 shows the HRR as a function of time. The growth of the fire is very fast, reaching a peak near 700 kW, 45 s after candle ignition. The decay is also fast, and reduces the fire to 50 kW 60 s after the peak. The peak value (pHRR) was 697 kW ± 25 kW. And the burning time t_b was 146 s ± 24 s. This was measured by visual observation using the video of the test and defined as the period going from first observed ignition of a tree element (between 0 and 24 s after candle ignition) to the end of significant flaming (between 146 s and 170 s).
A short video of the test can be seen below (NOTE: it starts 30 s after ignition and lasts for 55 s):
Measurements and guesses are plotted in Figure 3. There was only one guess falling within the measured result range. This person won the bet. For the quantification of how close a guess was to the measurements, the Euclidean distance was calculated, nondimensionalizing each guess by the measurement. The resulting average distance is 0.97, with minimum 0.1 and maximum 2.12. The control was at a distance of 0.26, well below the average and closer to the result than 89% of the participants.
The participants were grouped in three sets: Academics, Postdocs and Students. The years each participant has been researching fire was estimated and plotted against the distance of each guess (see Figure 4). There is a positive correlation of distance with experience. Students and postdocs show a similar large slope, but Academics are a distinct group from the rest and have a smaller slope.
Upon seeing this data, one could conclude that the longer you stay in research, the less you earn. And, study or gamble, but not both!
The tree was a Nordmann Fir of conical shape, 1.5 m tall and 0.9 m diameter at the bottom. It weighted 4.74 kg and was in dry conditions (measured in the oven at ~8% moisture content in dry base) after having spent one month not watered inside a warm living room.
Before conducting the experiment, fire experts were asked to bet on the peak heat release rate (pHRR) and the burning time (t_b). We recorded 28 guesses (£1 was collected per guess). A person with no research experience and no previous knowledge on fire dynamics (an international lawyer) was asked to provide a guess and act as control. NOTE: This required explaining the concept of HRR in layman terms, after which the control quantified the pHRR in terms of the equivalent number of burning matches.
Significant spread was recorded in the guesses. pHHR guesses ranged from 400 and 2300 kW, with average at 1173 kW. Guesses for t_b ranged from 15 to 377 s, with an average of 120 s. Two people provided guesses for pHRR but not for t_b, so they were assigned the average t_b value from the other participants.
 |
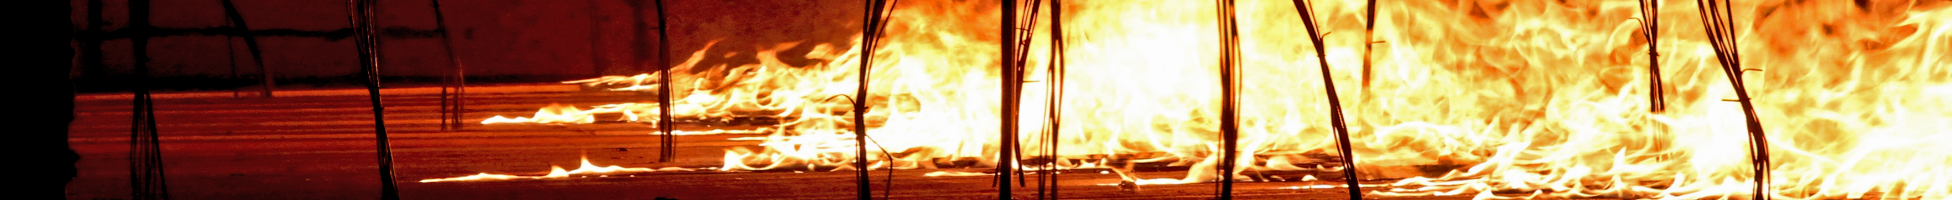
| Figure 1. Sequence of images, from left to right: The first day (early December 2010) when it was brought to the living room. Just seconds before ignition when the tree was inside the medium scale calorimeter. Fire spread over the tree about 40 s after ignition. Remains left after the test. |
The tree was ignited putting a small household candle next to the tree trunk at 1/3 of the height from the base. The HRR was measured using oxygen consumption calorimetry (corrected for CO and CO2 production). Figure 2 shows the HRR as a function of time. The growth of the fire is very fast, reaching a peak near 700 kW, 45 s after candle ignition. The decay is also fast, and reduces the fire to 50 kW 60 s after the peak. The peak value (pHRR) was 697 kW ± 25 kW. And the burning time t_b was 146 s ± 24 s. This was measured by visual observation using the video of the test and defined as the period going from first observed ignition of a tree element (between 0 and 24 s after candle ignition) to the end of significant flaming (between 146 s and 170 s).
 |
| Figure 2. Evolution of the HRR (power) as a function of time measured by oxygen consumption calorimetry.The ranges of observed times for the ignition of first tree element and end of flaming are indicated. |
A short video of the test can be seen below (NOTE: it starts 30 s after ignition and lasts for 55 s):
Measurements and guesses are plotted in Figure 3. There was only one guess falling within the measured result range. This person won the bet. For the quantification of how close a guess was to the measurements, the Euclidean distance was calculated, nondimensionalizing each guess by the measurement. The resulting average distance is 0.97, with minimum 0.1 and maximum 2.12. The control was at a distance of 0.26, well below the average and closer to the result than 89% of the participants.
 | |
|
The participants were grouped in three sets: Academics, Postdocs and Students. The years each participant has been researching fire was estimated and plotted against the distance of each guess (see Figure 4). There is a positive correlation of distance with experience. Students and postdocs show a similar large slope, but Academics are a distinct group from the rest and have a smaller slope.
 |
| Figure 4. Non-dimensional Euclidean distance from guess to measurements vs. years in fire research of each participants. Blue line is the trend of the Student and Postdoc populations. |
Upon seeing this data, one could conclude that the longer you stay in research, the less you earn. And, study or gamble, but not both!
Wednesday, February 09, 2011
EU Project on Aircraft Fire Safety starts
The University is one of 13 partners collaborating on a three year, EU funded research project in Aircraft Fire Safety. Below is a photo of the delegates who attended the 'kick-off' meeting in Poitiers, France, in January this year.

Subscribe to:
Posts (Atom)